Technical Analysis of BBJP 2024-05-03
Overview:
In analyzing the technical indicators for BBJP stock over the last 5 days, we will delve into the trend, momentum, volatility, and volume indicators to provide a comprehensive outlook on the possible stock price movement in the coming days. By examining these key indicators, we aim to offer valuable insights and recommendations for potential investors.
Trend Analysis:
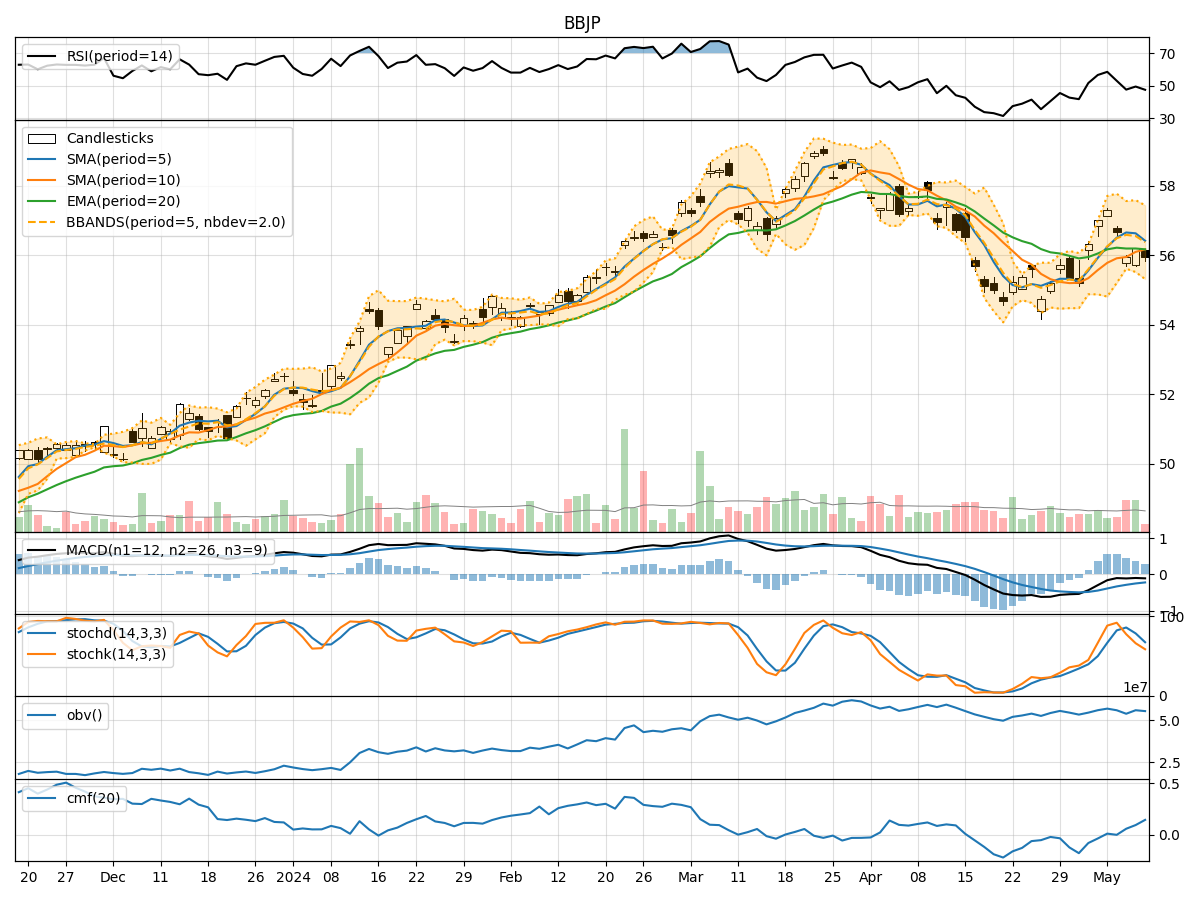
- Moving Averages (MA): The 5-day Moving Average (MA) has been fluctuating around the closing prices, indicating a lack of clear trend direction.
- MACD and Signal Line: The MACD has been negative, suggesting a bearish momentum in the short term.
- Relative Strength Index (RSI): The RSI has shown mixed signals, starting from oversold levels and moving towards neutral territory.
Momentum Analysis:
- Stochastic Oscillator: The Stochastic Oscillator has been rising, indicating increasing buying pressure and potential upward momentum.
- Williams %R (Willr): The Williams %R has moved from oversold to near-neutral levels, signaling a possible shift in momentum.
Volatility Analysis:
- Bollinger Bands (BB): The Bollinger Bands have widened, suggesting increased price volatility in the short term.
- Bollinger Band %B (bbp): The %B indicator has been fluctuating within a range, indicating potential price consolidation.
Volume Analysis:
- On-Balance Volume (OBV): The OBV has shown mixed signals, with no clear trend in volume accumulation or distribution.
- Chaikin Money Flow (CMF): The CMF has been negative, indicating potential selling pressure in the market.
Key Observations and Opinions:
- Trend: The trend indicators suggest a lack of clear direction, with a slightly bearish bias based on the MACD.
- Momentum: Momentum indicators show a potential shift towards bullish momentum, supported by the Stochastic Oscillator and Williams %R.
- Volatility: Volatility has increased, indicating potential price swings, while %B suggests a period of consolidation.
- Volume: Volume indicators do not provide a clear trend, with mixed signals from OBV and CMF.
Conclusion:
Based on the analysis of the technical indicators, the next few days for BBJP stock could see upward momentum with increased volatility and potential price consolidation. Investors should closely monitor the Stochastic Oscillator and Williams %R for confirmation of the bullish momentum. However, it is essential to exercise caution and consider other fundamental factors before making investment decisions.