Technical Analysis of BALT 2024-05-10
Overview:
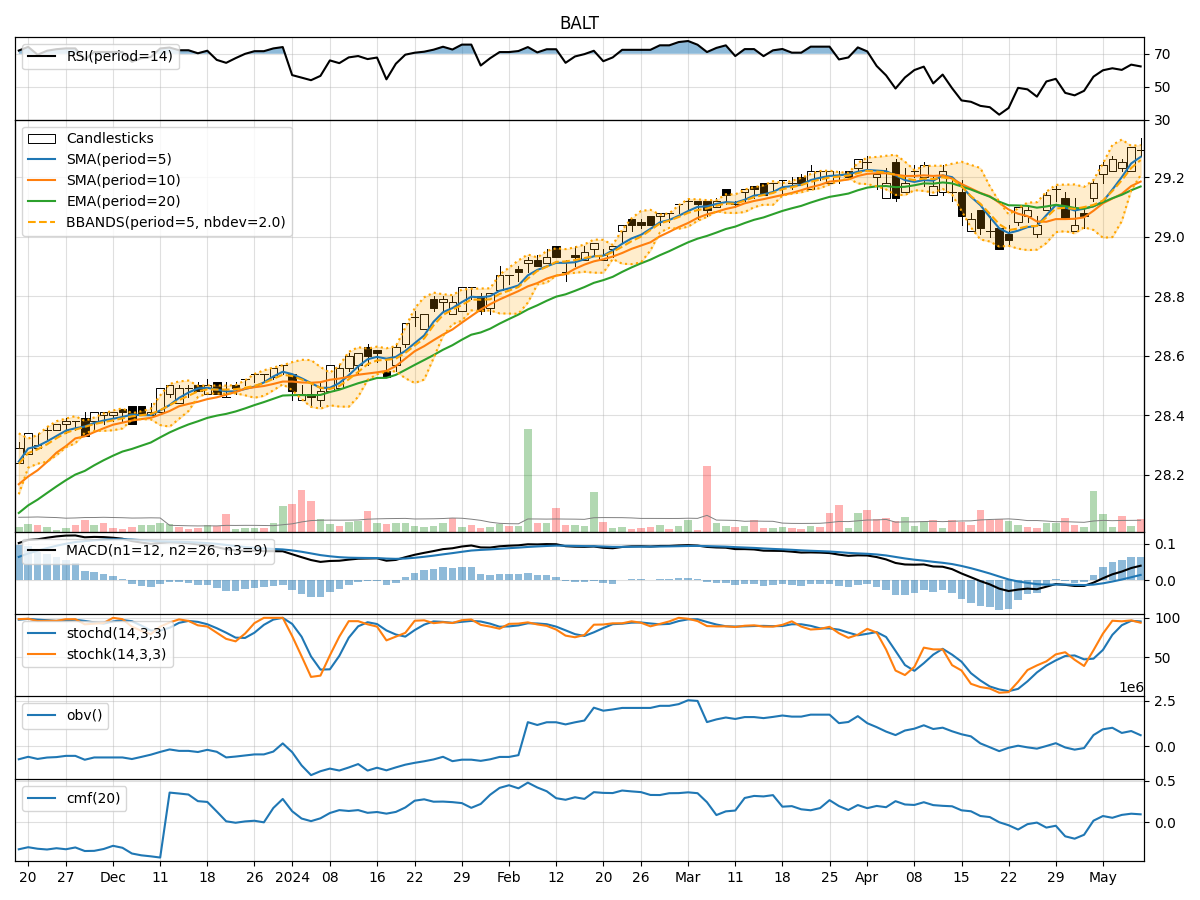
In analyzing the technical indicators for BALT over the last 5 days, we will delve into the trend, momentum, volatility, and volume indicators to provide a comprehensive outlook on the possible stock price movement in the coming days.
Trend Analysis:
- Moving Averages (MA): The 5-day Moving Average (MA) has been consistently above the Simple Moving Average (SMA) and Exponential Moving Average (EMA), indicating a bullish trend.
- MACD: The MACD line has been consistently above the signal line, with the MACD histogram showing an increasing positive trend, further supporting the bullish momentum.
Momentum Analysis:
- RSI: The Relative Strength Index (RSI) has been hovering around the 60-63 range, indicating a neutral to slightly bullish momentum.
- Stochastic Oscillator: Both %K and %D have been consistently high, suggesting strong buying pressure and potential overbought conditions.
- Williams %R: The Williams %R is fluctuating around -3% to -12%, indicating potential overbought conditions.
Volatility Analysis:
- Bollinger Bands: The stock price has been trading within the Bollinger Bands, with the bands narrowing, suggesting decreasing volatility.
- Bollinger %B: The %B indicator has been fluctuating around 0.6 to 0.8, indicating that the stock is trading closer to the upper band.
Volume Analysis:
- On-Balance Volume (OBV): The OBV has shown mixed signals, with some days experiencing selling pressure and others showing accumulation.
- Chaikin Money Flow (CMF): The CMF has been positive, indicating buying pressure over the 20-day period.
Key Observations:
- The trend indicators suggest a strong bullish sentiment, supported by the MACD and moving averages.
- Momentum indicators show a neutral to slightly bullish momentum, with potential overbought conditions.
- Volatility has been decreasing, indicating a possible consolidation phase.
- Volume indicators show mixed signals, with some accumulation and distribution periods.
Conclusion:
Based on the analysis of the technical indicators, the next few days for BALT are likely to see continued upward movement in the stock price. The strong bullish trend, supported by the MACD and moving averages, suggests that the stock is poised for further gains. However, caution should be exercised due to potential overbought conditions indicated by the momentum indicators. The decreasing volatility and mixed volume signals may lead to a consolidation phase before potential further upside. Investors should closely monitor the price action and key support and resistance levels for potential entry or exit points.