Technical Analysis of AVLV 2024-05-10
Overview:
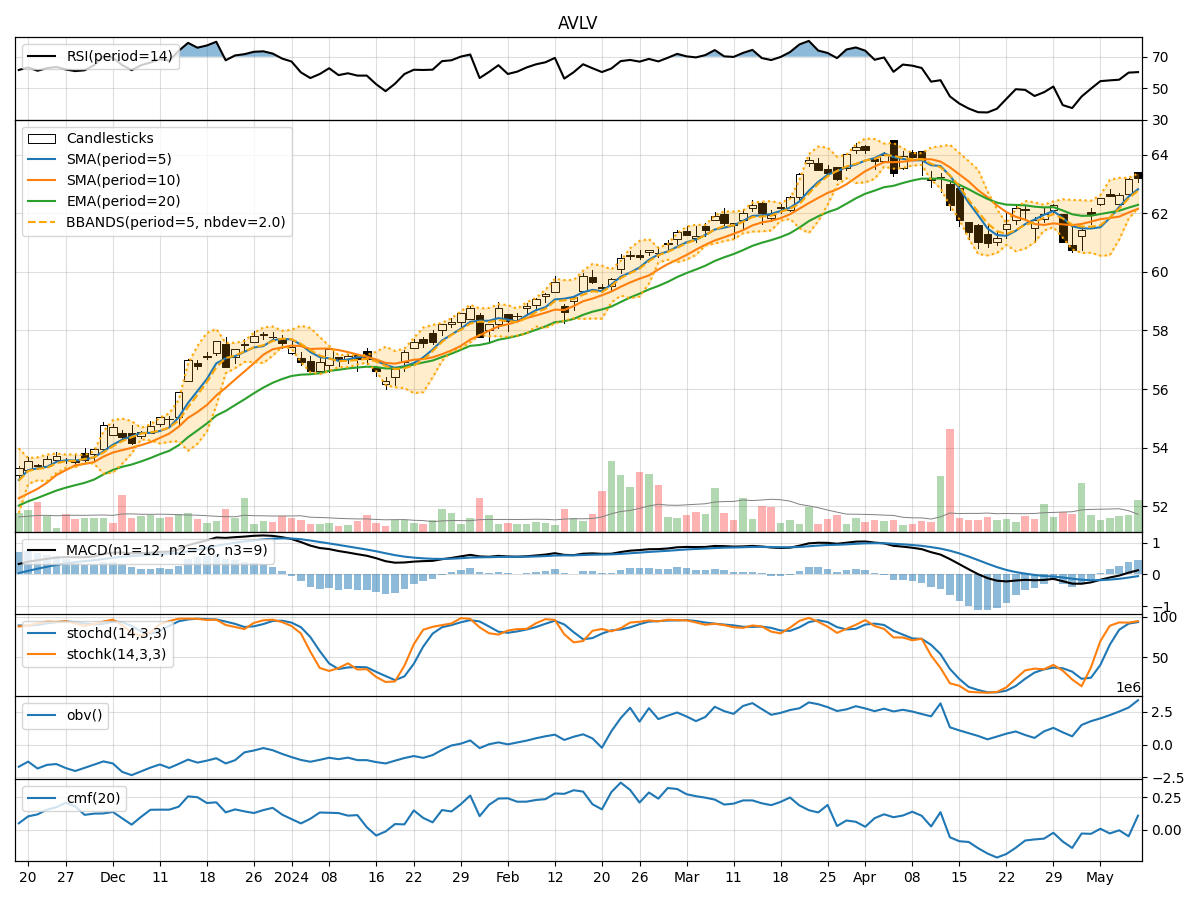
In analyzing the technical indicators for AVLV over the last 5 days, we will delve into the trend, momentum, volatility, and volume indicators to provide a comprehensive outlook on the possible stock price movement in the coming days. By examining these key aspects, we aim to offer valuable insights and predictions for potential investors.
Trend Analysis:
- Moving Averages (MA): The 5-day MA has been consistently trending above the closing prices, indicating a bullish trend.
- MACD: The MACD line has been positive and increasing, suggesting bullish momentum.
- RSI: The RSI has been in the neutral to slightly overbought territory, indicating potential strength in the current trend.
Key Observation: The trend indicators point towards a bullish sentiment in the stock price movement.
Momentum Analysis:
- Stochastic Oscillator: Both %K and %D have been in the overbought zone, signaling potential for a pullback.
- Williams %R: The indicator has been fluctuating around the oversold region, suggesting a possible reversal.
Key Observation: Momentum indicators show a mixed signal, with potential for a short-term correction.
Volatility Analysis:
- Bollinger Bands (BB): The bands have been narrowing, indicating decreasing volatility.
- BB %B: The %B has been hovering around 0.8, suggesting a relatively high price compared to recent movements.
Key Observation: Volatility indicators suggest a consolidation phase with a potential breakout in either direction.
Volume Analysis:
- On-Balance Volume (OBV): The OBV has been steadily increasing, reflecting positive volume flow.
- Chaikin Money Flow (CMF): The CMF has been fluctuating around the zero line, indicating a balance between buying and selling pressure.
Key Observation: Volume indicators point towards accumulation by investors.
Conclusion:
Based on the analysis of the technical indicators, the next few days' possible stock price movement for AVLV is likely to see a bullish continuation in the short term, supported by the trend indicators. However, the momentum indicators suggest a potential for a short-term correction or consolidation before resuming the uptrend. The volatility indicators hint at a possible breakout in either direction, while volume indicators indicate positive accumulation.
Recommendation:
- Short-term Traders: Consider taking profits or setting stop-loss orders to manage potential corrections.
- Long-term Investors: Hold positions with a focus on the bullish trend but remain vigilant for any signs of reversal.
In conclusion, a cautiously bullish stance is advised, with a keen eye on momentum shifts and breakout opportunities. Conducting further analysis and monitoring key levels will be crucial in navigating the upcoming price movements in AVLV.