Technical Analysis of AVIG 2024-05-10
Overview:
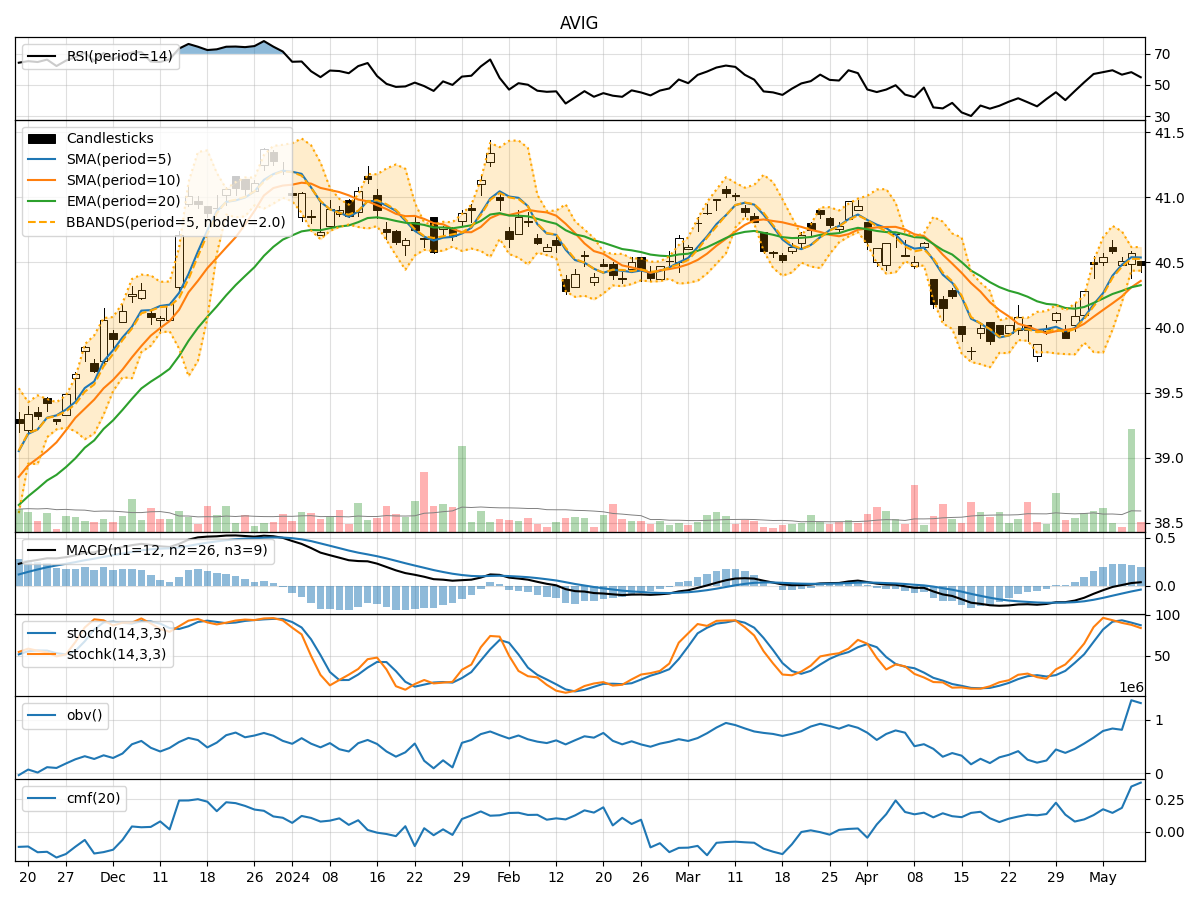
In analyzing the technical indicators for AVIG over the last 5 days, we will delve into the trend, momentum, volatility, and volume indicators to provide a comprehensive outlook on the possible stock price movement in the coming days.
Trend Analysis:
- Moving Averages (MA): The 5-day Moving Average (MA) has been consistently above the Simple Moving Average (SMA) and Exponential Moving Average (EMA), indicating a short-term bullish trend.
- MACD: The MACD line has been consistently above the signal line, with both lines showing an upward trend, suggesting bullish momentum.
- Conclusion: The trend indicators point towards an upward trend in the stock price.
Momentum Analysis:
- RSI: The Relative Strength Index (RSI) has been fluctuating around the 50 level, indicating a neutral momentum.
- Stochastic Oscillator: Both %K and %D have been decreasing, suggesting a weakening momentum.
- Conclusion: The momentum indicators suggest a neutral to slightly bearish momentum in the stock.
Volatility Analysis:
- Bollinger Bands (BB): The stock price has been trading within the Bollinger Bands, with the bands narrowing, indicating decreasing volatility.
- Conclusion: The volatility indicators signal a decreasing volatility in the stock price.
Volume Analysis:
- On-Balance Volume (OBV): The OBV has been fluctuating, indicating mixed buying and selling pressure.
- Chaikin Money Flow (CMF): The CMF has been positive, suggesting a net inflow of money into the stock.
- Conclusion: The volume indicators show mixed signals with a slight bullish bias.
Conclusion:
Based on the analysis of the technical indicators, the stock of AVIG is likely to experience sideways movement in the coming days, with a potential for a slight upward bias due to the bullish trend indicators. However, the neutral to slightly bearish momentum and mixed volume signals may limit significant upward movements. Traders should exercise caution and closely monitor the price action for any potential breakout or reversal signals.
Recommendation:
- Short-term Traders: Consider taking profit at key resistance levels and closely monitor for potential reversal signals.
- Long-term Investors: Hold positions with a cautious outlook, considering the mixed signals in momentum and volume indicators.
- Risk Management: Implement tight stop-loss orders to protect gains and manage risk effectively in the current market environment.
By combining insights from trend, momentum, volatility, and volume indicators, traders and investors can make informed decisions to navigate the market dynamics of AVIG effectively.