Technical Analysis of ARKA 2024-05-10
Overview:
In analyzing the technical indicators for ARKA stock over the last 5 days, we will delve into the trend, momentum, volatility, and volume indicators to provide a comprehensive outlook on the possible future stock price movement. By examining these key indicators, we aim to offer valuable insights and recommendations for potential investors.
Trend Analysis:
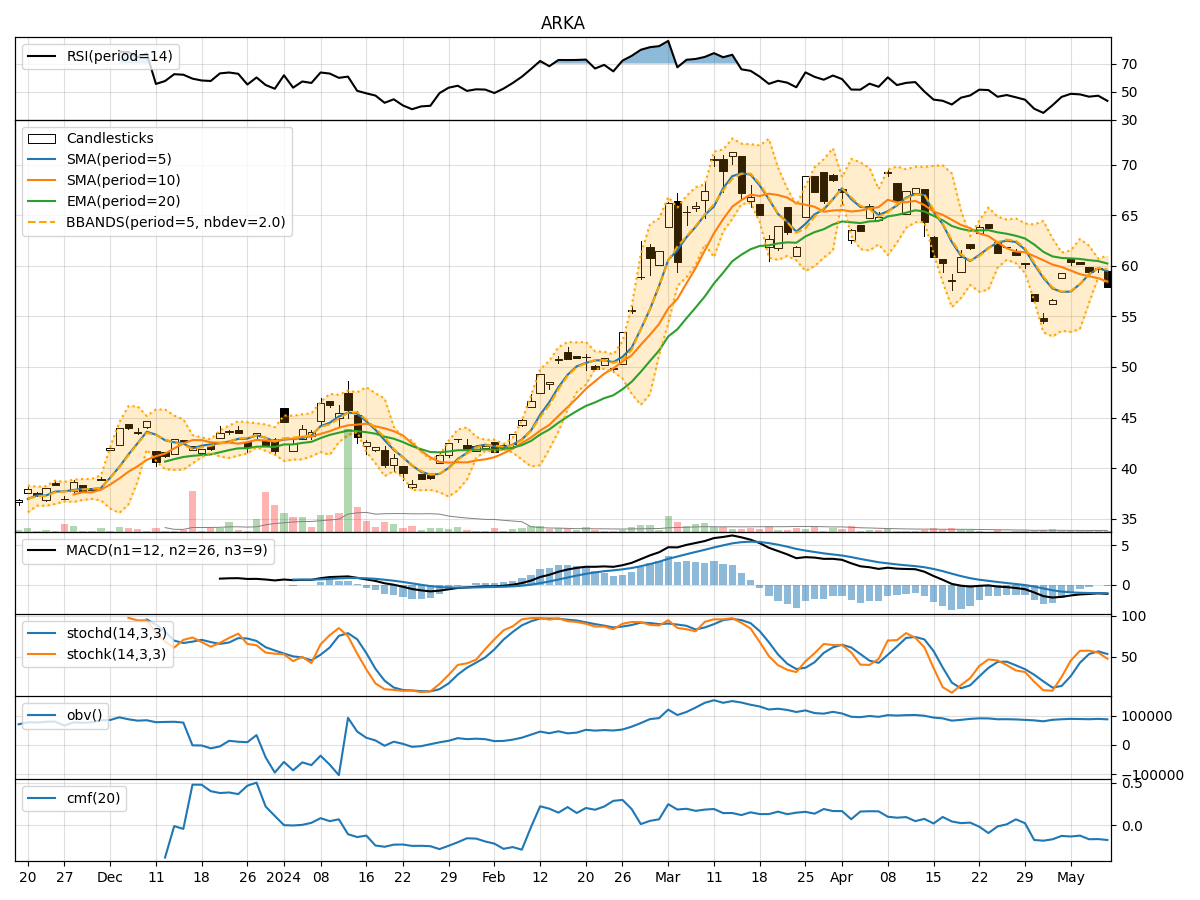
- Moving Averages (MA): The 5-day Moving Average (MA) has been consistently above the Simple Moving Average (SMA) and Exponential Moving Average (EMA) over the past 5 days, indicating a short-term uptrend.
- MACD: The Moving Average Convergence Divergence (MACD) has been negative, suggesting a bearish momentum in the stock price.
Momentum Analysis:
- RSI: The Relative Strength Index (RSI) has been fluctuating around the mid-level, indicating a lack of strong momentum in either direction.
- Stochastic Oscillator: Both %K and %D have been hovering around the neutral zone, reflecting a balanced momentum.
Volatility Analysis:
- Bollinger Bands (BB): The stock price has been trading within the Bollinger Bands, with the bands narrowing, indicating decreasing volatility.
Volume Analysis:
- On-Balance Volume (OBV): The OBV has been relatively stable, suggesting a lack of significant buying or selling pressure.
- Chaikin Money Flow (CMF): The CMF has been negative, indicating a slight distribution phase in the stock.
Key Observations:
- The trend indicators suggest a short-term uptrend, while the momentum indicators show a lack of strong momentum in either direction.
- Volatility has been decreasing, indicating a potential period of consolidation or sideways movement.
- Volume indicators do not show significant buying or selling pressure, reflecting a neutral sentiment among investors.
Conclusion:
Based on the analysis of the technical indicators, the next few days for ARKA stock are likely to see sideways movement with limited volatility. The lack of strong momentum and stable volume suggest a period of consolidation. Investors may expect the stock price to trade within a narrow range in the near term. It is advisable to closely monitor key support and resistance levels for potential breakout opportunities.