Technical Analysis of AOHY 2024-05-10
Overview:
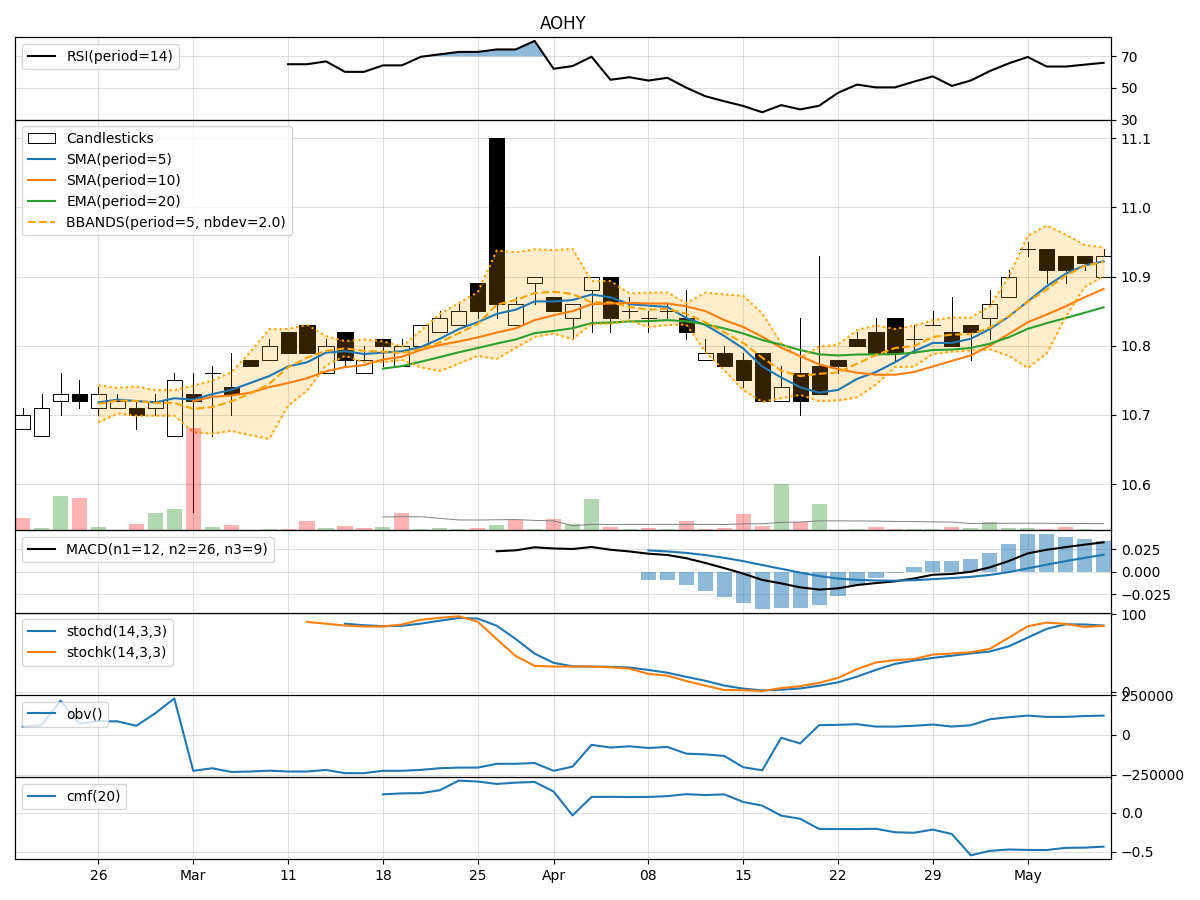
In analyzing the technical indicators for AOHY over the last 5 days, we will delve into the trends, momentum, volatility, and volume aspects to provide a comprehensive outlook on the possible stock price movement. By examining key indicators such as moving averages, MACD, RSI, Bollinger Bands, and OBV, we aim to offer valuable insights and predictions for the upcoming days.
Trend Analysis:
- Moving Averages (MA): The 5-day MA has been consistently above the closing price, indicating a short-term uptrend.
- MACD: The MACD line has been steadily increasing, with the MACD histogram showing positive values, suggesting bullish momentum.
Momentum Analysis:
- RSI: The RSI has been in the overbought territory, indicating a potential reversal or consolidation.
- Stochastic Oscillator: Both %K and %D have been relatively high, signaling potential overbought conditions.
Volatility Analysis:
- Bollinger Bands (BB): The stock price has been trading within the bands, suggesting a period of consolidation.
Volume Analysis:
- On-Balance Volume (OBV): The OBV has been relatively stable, indicating a balance between buying and selling pressure.
Key Observations:
- The stock has shown signs of bullish momentum based on the moving averages and MACD.
- However, the overbought RSI and Stochastic indicators suggest a potential reversal or consolidation.
- The Bollinger Bands indicate a period of consolidation, while the OBV reflects a balanced volume trend.
Conclusion:
Based on the analysis of the technical indicators, the next few days for AOHY could see a potential consolidation phase with a slight bias towards a bearish reversal. Traders should exercise caution as the stock may experience a pullback or sideways movement in the near term. It is advisable to closely monitor key support and resistance levels for potential entry or exit points.
Recommendation:
- Consider implementing risk management strategies to protect gains in case of a downside move.
- Wait for confirmation signals from key indicators before making significant trading decisions.
- Stay updated on market news and events that could impact the stock price movement.
By combining technical analysis with market insights, traders can make informed decisions and navigate the dynamic landscape of the stock market effectively.