Technical Analysis of AIYY 2024-05-10
Overview:
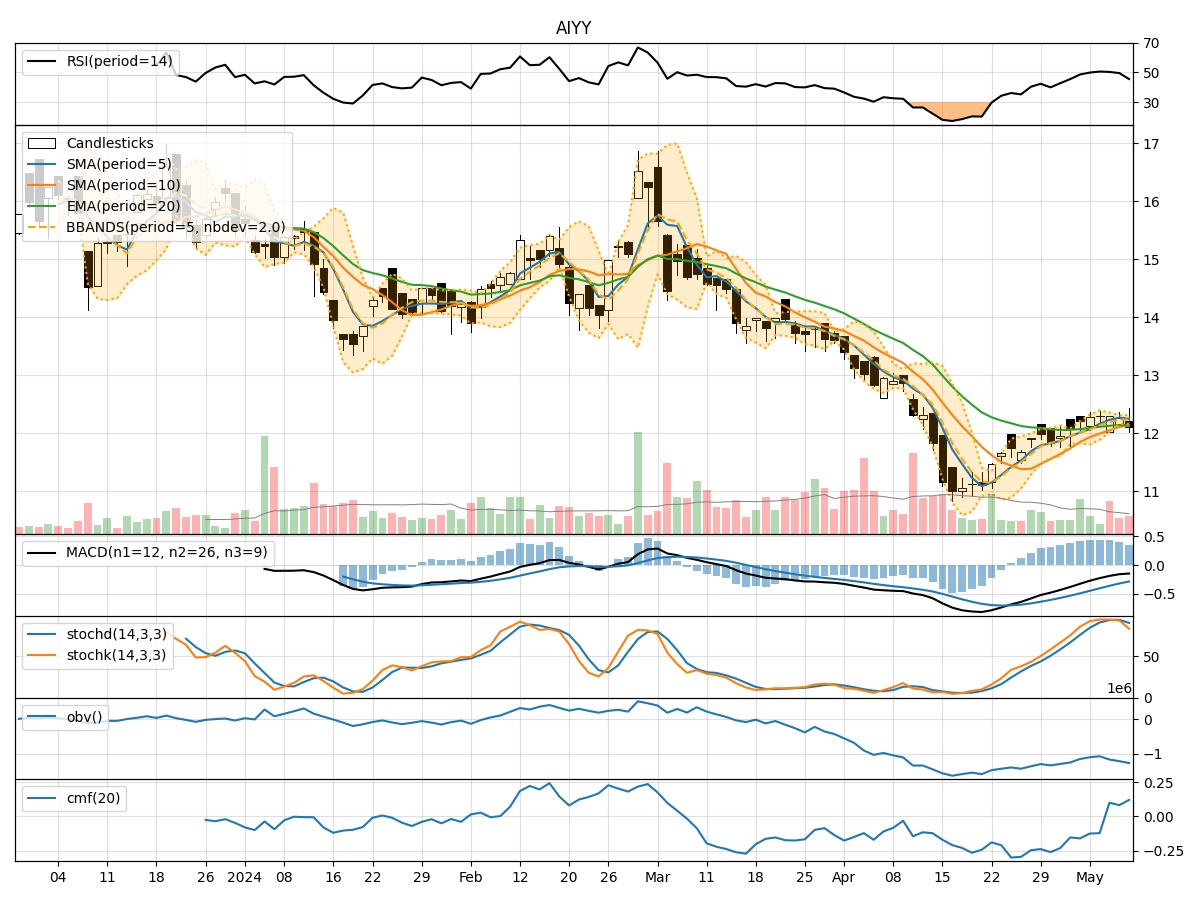
In analyzing the technical indicators for AIYY stock over the last 5 days, we will delve into the trends, momentum, volatility, and volume aspects to provide a comprehensive outlook on the possible future stock price movement. By examining key indicators such as moving averages, MACD, RSI, Bollinger Bands, and OBV, we aim to offer valuable insights and predictions for the upcoming trading days.
Trend Analysis:
- Moving Averages (MA): The 5-day moving average has been consistently above the closing prices, indicating a short-term uptrend.
- MACD: The MACD line has been below the signal line, suggesting a bearish momentum in the short term.
- EMA: The exponential moving average has been relatively stable, reflecting a neutral trend.
Momentum Analysis:
- RSI: The RSI values have been fluctuating around the 50 level, indicating a lack of strong momentum in either direction.
- Stochastic Oscillator: Both %K and %D values have been declining, signaling a potential bearish momentum.
- Williams %R: The Williams %R is in oversold territory, suggesting a possible reversal in the short term.
Volatility Analysis:
- Bollinger Bands: The stock price has been trading within the bands, with the lower band providing support.
- Bollinger %B: The %B indicator is close to 0, indicating a potential oversold condition.
- Bollinger Band Width: The band width has been narrowing, suggesting a decrease in volatility.
Volume Analysis:
- On-Balance Volume (OBV): The OBV values have been declining, indicating selling pressure in the stock.
- Chaikin Money Flow (CMF): The CMF has been fluctuating around the zero line, reflecting a balance between buying and selling pressure.
Conclusion:
Based on the analysis of the technical indicators, the stock is currently in a sideways consolidation phase with a slight bearish bias. The lack of strong momentum, coupled with declining volume and narrowing volatility, suggests a period of indecision in the market. Traders should exercise caution and wait for clearer signals before taking any significant positions.
In the next few days, we anticipate the stock price to continue trading within a tight range, potentially testing support levels. Investors should closely monitor key support and resistance levels for potential breakout or breakdown scenarios. It is advisable to wait for confirmation from the indicators before making any trading decisions.