Technical Analysis of AIA 2024-05-10
Overview:
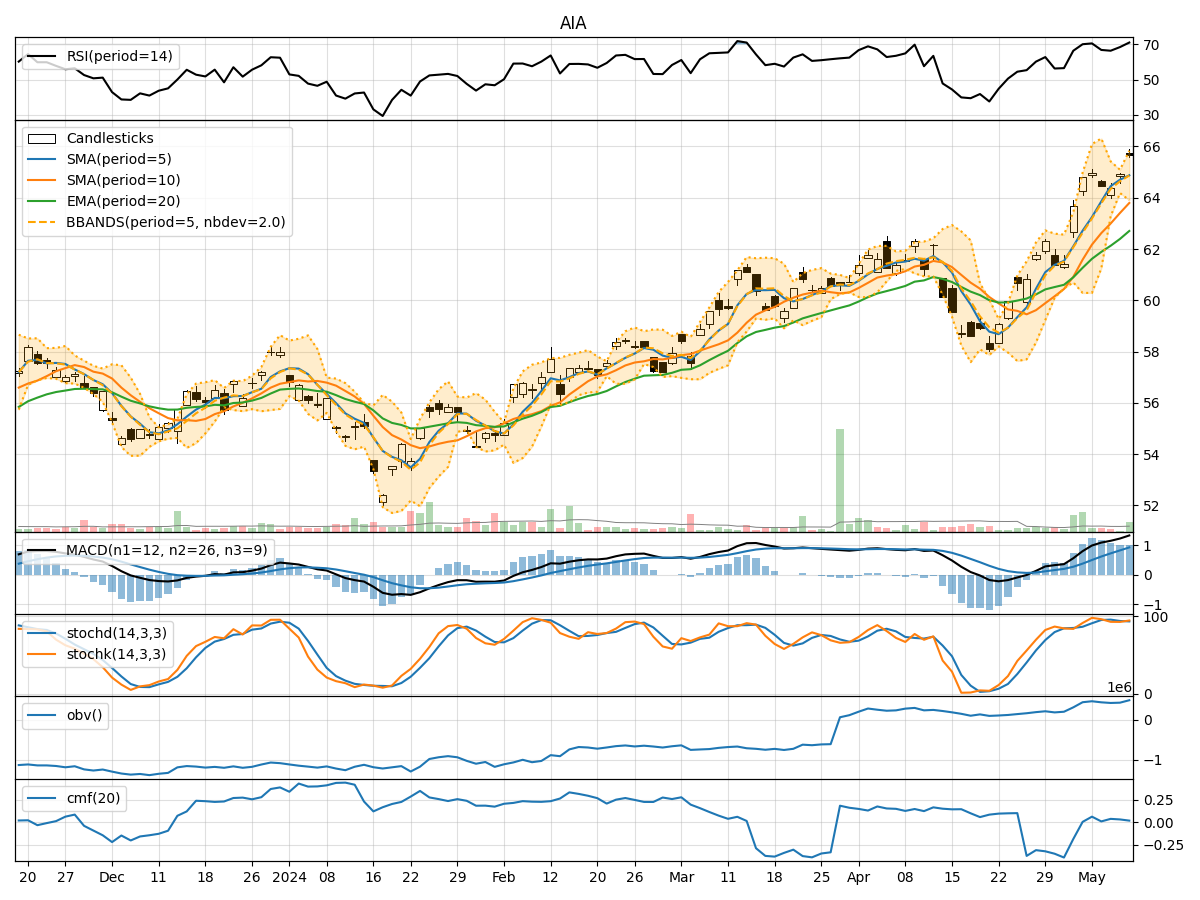
In the last 5 trading days, AIA stock has shown a consistent uptrend in its closing price, accompanied by increasing trading volumes. The trend indicators such as Moving Averages and MACD suggest a bullish momentum, supported by positive values. Momentum indicators like RSI and Stochastic oscillators indicate overbought conditions but still show strength in the current uptrend. Volatility indicators like Bollinger Bands suggest a narrowing range, potentially indicating a period of consolidation. Volume indicators show a slight increase in On-Balance Volume (OBV) and Chaikin Money Flow (CMF), reflecting accumulation.
Trend Analysis:
- Moving Averages (MA): The 5-day Moving Average has been consistently above the longer-term Moving Averages (SMA and EMA), indicating a strong uptrend.
- MACD: The MACD line has been above the signal line, with both lines showing positive values, indicating bullish momentum.
Momentum Analysis:
- RSI: The Relative Strength Index (RSI) is in the overbought territory, suggesting a potential pullback or consolidation.
- Stochastic Oscillators: Both %K and %D lines are in the overbought zone, indicating a possible reversal or correction.
Volatility Analysis:
- Bollinger Bands (BB): The Bollinger Bands are narrowing, suggesting decreasing volatility and a potential period of consolidation.
Volume Analysis:
- On-Balance Volume (OBV): The OBV has shown a slight increase, indicating accumulation by investors.
- Chaikin Money Flow (CMF): The CMF is positive, suggesting buying pressure in the stock.
Key Observations:
- The stock is currently in a strong uptrend, supported by moving averages and MACD.
- Momentum indicators signal overbought conditions, which may lead to a short-term correction or consolidation.
- Volatility is decreasing, indicating a potential period of sideways movement.
- Volume indicators show accumulation, supporting the current uptrend.
Conclusion:
Based on the technical analysis of AIA stock: - The stock is likely to experience a short-term correction or consolidation due to overbought conditions indicated by momentum indicators. - However, the overall trend remains bullish, supported by moving averages and positive MACD values. - Volatility is expected to decrease, leading to a period of sideways movement before a potential continuation of the uptrend. - Investors should monitor the stock closely for signs of a reversal or continuation of the current trend.
Recommendation:
- Consider taking profits if holding a short-term position due to overbought conditions.
- For long-term investors, hold the position with a trailing stop-loss to protect gains in case of a sudden reversal.
- Wait for a clear signal from momentum indicators before considering new entry points.
By analyzing the technical indicators comprehensively, it is evident that while a short-term correction or consolidation is likely, the overall trend for AIA stock remains bullish. It is essential for investors to stay vigilant and adapt their strategies accordingly to navigate potential market movements effectively.