Technical Analysis of AHYB 2024-05-10
Overview:
In analyzing the technical indicators for AHYB stock over the last 5 days, we will delve into the trend, momentum, volatility, and volume indicators to provide a comprehensive outlook on the possible stock price movement in the coming days. By examining these key indicators, we aim to offer valuable insights and predictions for potential investors.
Trend Analysis:
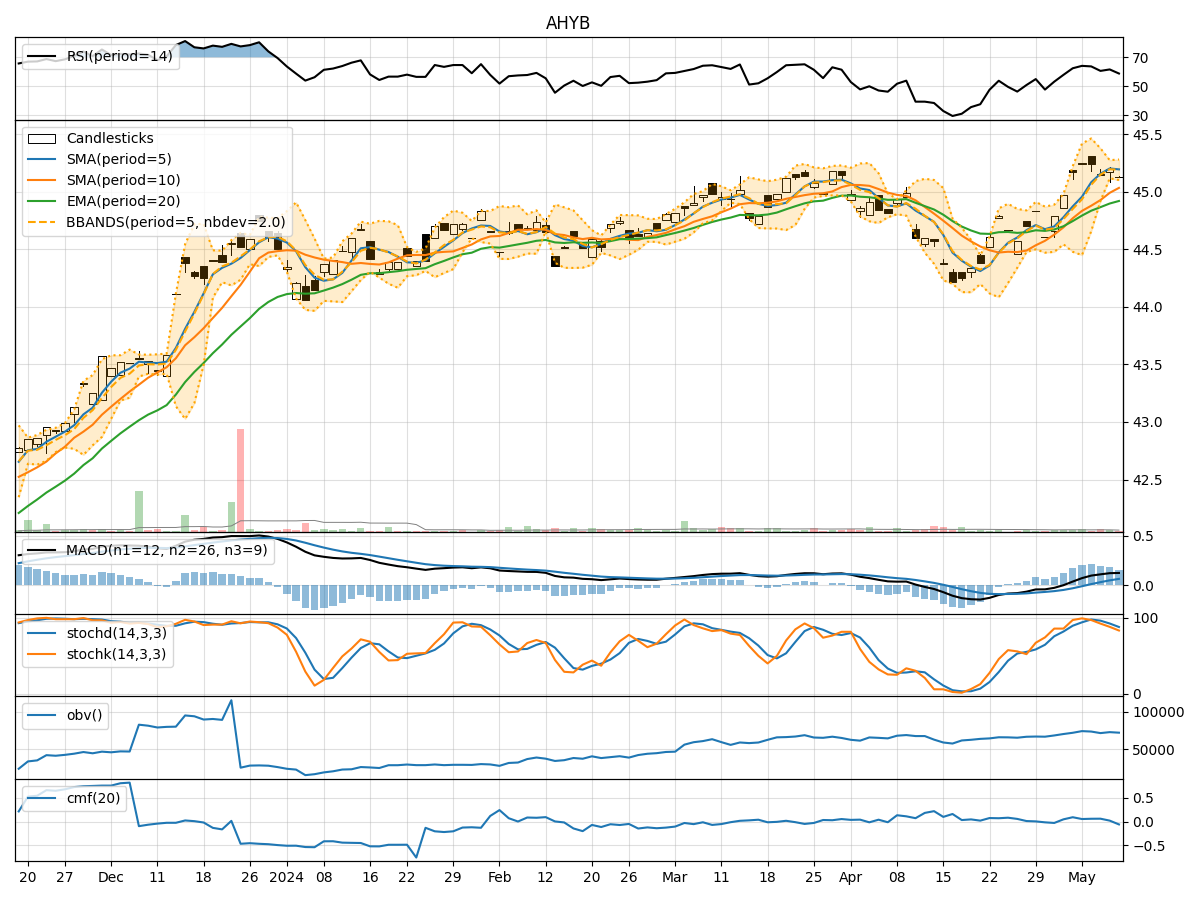
- Moving Averages (MA): The 5-day Moving Average (MA) has been consistently above the Simple Moving Average (SMA) and Exponential Moving Average (EMA), indicating a bullish trend.
- MACD: The MACD line has been consistently above the signal line, with both lines showing an upward trend, suggesting bullish momentum.
- Conclusion: The trend indicators suggest a strong bullish sentiment in the stock price movement.
Momentum Analysis:
- RSI: The Relative Strength Index (RSI) has been fluctuating around the overbought territory, indicating strong buying momentum.
- Stochastic Oscillator: Both %K and %D lines of the Stochastic Oscillator have been decreasing, signaling a potential reversal in momentum.
- Conclusion: The momentum indicators suggest a mixed sentiment with a possibility of a slight pullback in the short term.
Volatility Analysis:
- Bollinger Bands (BB): The stock price has been trading within the Bollinger Bands, with the bands narrowing, indicating decreasing volatility.
- Conclusion: The volatility indicators suggest a decreasing volatility in the stock price movement.
Volume Analysis:
- On-Balance Volume (OBV): The OBV has been fluctuating, indicating indecision among investors regarding the stock.
- Chaikin Money Flow (CMF): The CMF has been positive but decreasing, suggesting a potential outflow of money from the stock.
- Conclusion: The volume indicators suggest mixed sentiment with a possibility of decreasing buying pressure.
Overall Conclusion:
Based on the analysis of the technical indicators, the stock of AHYB is currently experiencing a strong bullish trend supported by the moving averages and MACD. However, the momentum indicators show a mixed sentiment with a potential for a slight pullback in the short term. The volatility is decreasing, indicating a possible period of consolidation, while the volume indicators suggest mixed sentiment with a potential decrease in buying pressure.
Forecast:
Considering the overall analysis, it is likely that AHYB stock may experience a short-term pullback or consolidation before potentially resuming its bullish trend. Investors should closely monitor the momentum indicators for any signs of a reversal in the short term. It is advisable to exercise caution and wait for more clarity in the market dynamics before making significant investment decisions.