Technical Analysis of AGGH 2024-05-10
Overview:
In analyzing the technical indicators for AGGH over the last 5 days, we will delve into the trend, momentum, volatility, and volume indicators to provide a comprehensive outlook on the possible stock price movement in the coming days.
Trend Analysis:
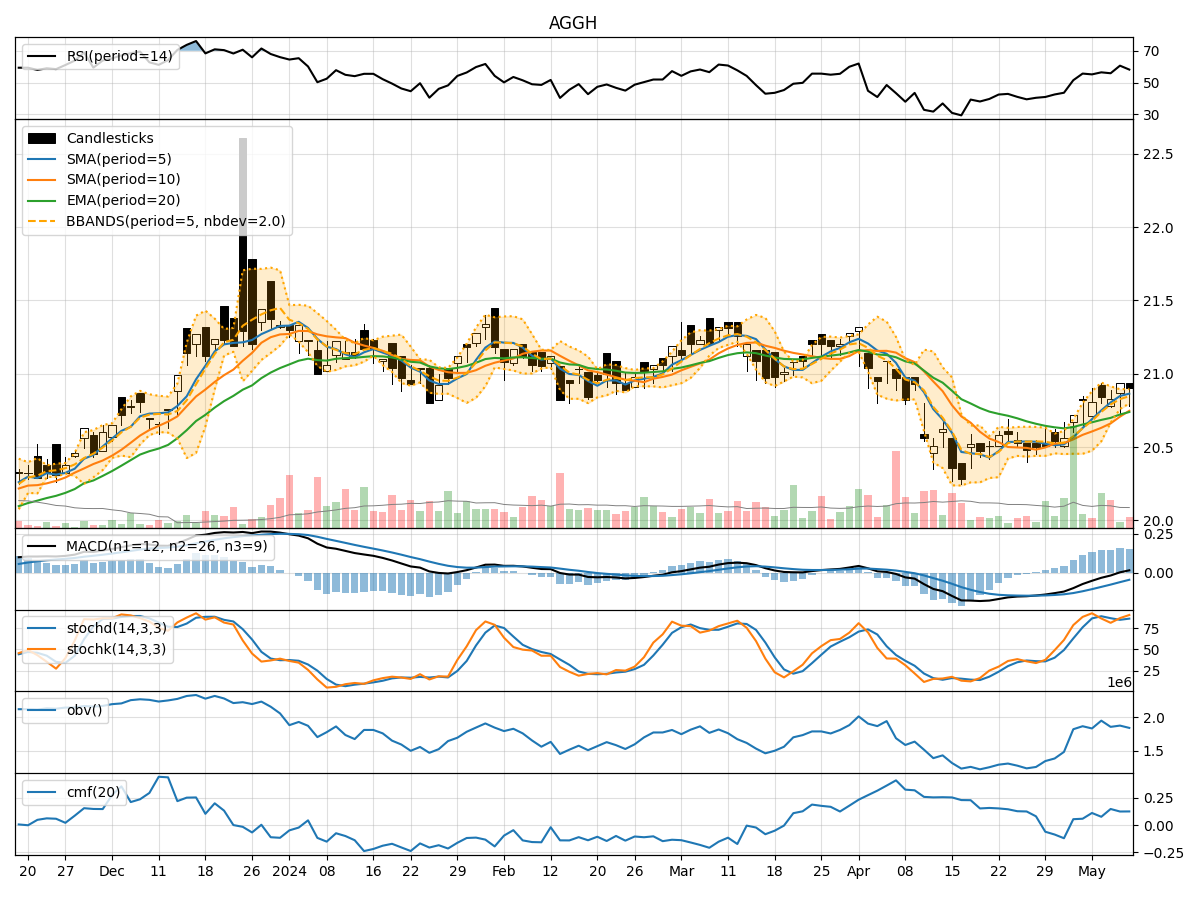
- Moving Averages (MA): The 5-day Moving Average (MA) has been consistently above the Simple Moving Average (SMA) and Exponential Moving Average (EMA), indicating a short-term bullish trend.
- MACD: The MACD line has been consistently above the signal line, with the MACD Histogram showing positive values, suggesting a bullish momentum.
Momentum Analysis:
- RSI: The Relative Strength Index (RSI) has been fluctuating around the 50 level, indicating a neutral momentum.
- Stochastic Oscillator: Both %K and %D have been in the overbought zone, suggesting a potential reversal or consolidation.
Volatility Analysis:
- Bollinger Bands (BB): The stock price has been trading within the Bollinger Bands, with the bands narrowing, indicating decreasing volatility.
Volume Analysis:
- On-Balance Volume (OBV): The OBV has shown mixed movements, reflecting indecision among market participants.
- Chaikin Money Flow (CMF): The CMF has been positive but relatively flat, signaling a lack of strong buying or selling pressure.
Key Observations:
- The trend indicators suggest a bullish bias in the short term.
- Momentum indicators show a neutral stance with a potential for a reversal.
- Volatility has been decreasing, indicating a possible period of consolidation.
- Volume indicators reflect mixed sentiment among investors.
Conclusion:
Based on the analysis of the technical indicators, the next few days for AGGH could see sideways movement with a slight bullish bias. Traders should watch for potential reversals indicated by the Stochastic Oscillator and monitor the RSI for any shifts in momentum. The narrowing Bollinger Bands suggest a period of consolidation, while the OBV and CMF indicate a lack of strong conviction from market participants. Overall, a cautious approach with a focus on key support and resistance levels is recommended.
Disclaimer:
This analysis is based solely on technical indicators and does not take into account fundamental factors that may impact stock prices. It is essential to conduct thorough research and consider multiple sources of information before making any investment decisions.