Technical Analysis of AESR 2024-05-10
Overview:
In analyzing the technical indicators for AESR over the last 5 days, we will delve into the trend, momentum, volatility, and volume indicators to provide a comprehensive outlook on the possible stock price movement. By examining these key factors, we aim to offer valuable insights and predictions for the upcoming trading days.
Trend Analysis:
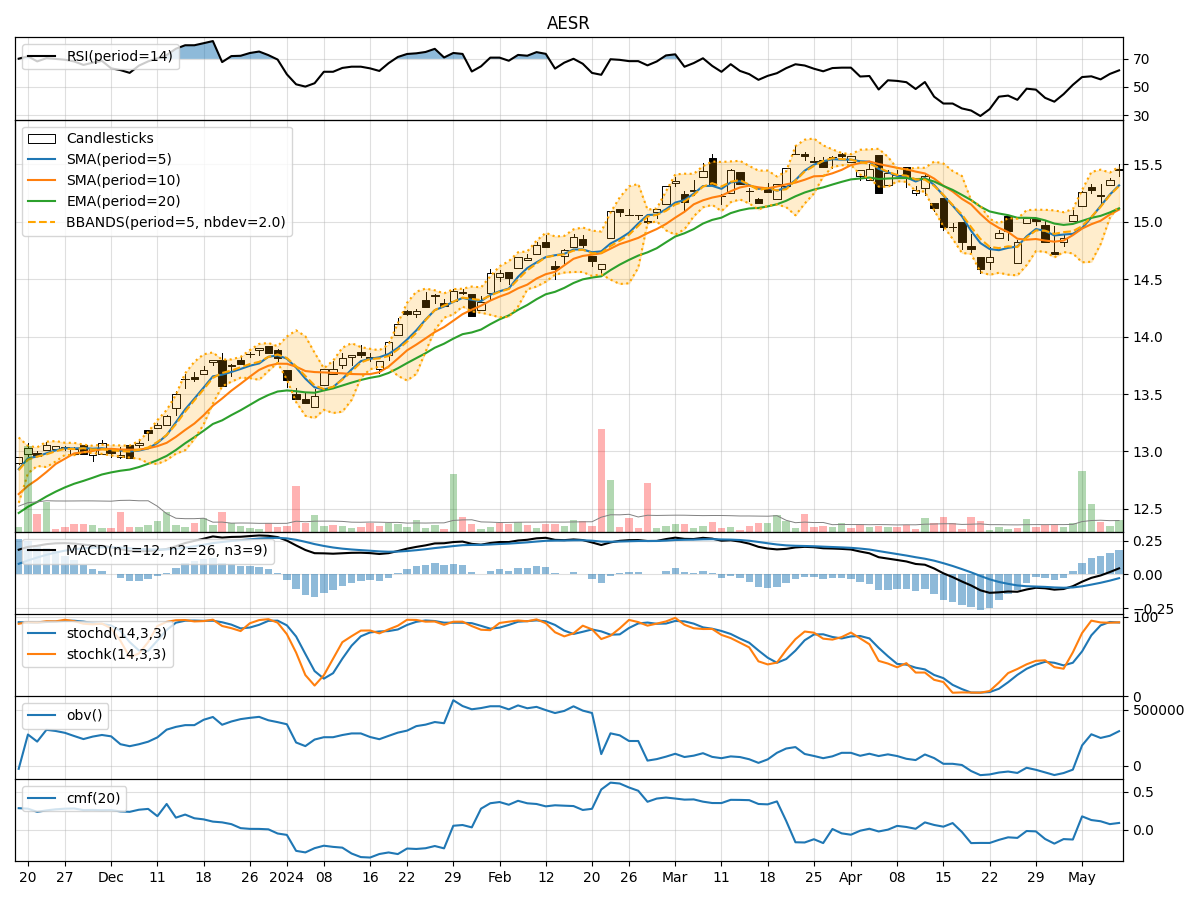
- Moving Averages (MA): The 5-day Moving Average (MA) has been consistently above the Simple Moving Average (SMA) and Exponential Moving Average (EMA), indicating a bullish trend.
- MACD: The MACD line has been consistently above the signal line, with both lines showing an upward trend, suggesting bullish momentum.
- RSI: The Relative Strength Index (RSI) has been fluctuating around the 60-70 range, indicating a neutral to slightly bullish sentiment.
Momentum Analysis:
- Stochastic Oscillator: The Stochastic Oscillator has been in the overbought territory, suggesting a potential reversal or consolidation in the near term.
- Williams %R: The Williams %R indicator has been hovering in the oversold region, signaling a possible bullish reversal.
Volatility Analysis:
- Bollinger Bands (BB): The Bollinger Bands have been widening, indicating increased volatility in the stock price.
- BB %B: The %B indicator has been fluctuating around the middle range, suggesting a neutral stance in terms of volatility.
Volume Analysis:
- On-Balance Volume (OBV): The OBV has been showing a slight decline, indicating a decrease in buying pressure.
- Chaikin Money Flow (CMF): The CMF has been relatively stable, reflecting a neutral sentiment towards the stock.
Key Observations:
- The trend indicators suggest a bullish outlook, supported by the MACD and moving averages.
- Momentum indicators show conflicting signals with the Stochastic Oscillator in overbought territory and Williams %R in oversold territory.
- Volatility has increased, as indicated by the widening Bollinger Bands.
- Volume indicators point towards a slight decrease in buying pressure.
Conclusion:
Based on the analysis of the technical indicators, the stock price of AESR is likely to experience further upward movement in the next few days. The bullish trend indicated by the moving averages and MACD, coupled with stable momentum and moderate volatility, supports this outlook. However, caution is advised due to conflicting signals in the momentum indicators, which could lead to short-term consolidation or a minor pullback before resuming the upward trend. Overall, the bullish bias is favored, but monitoring the momentum indicators closely is recommended for potential shifts in market sentiment.