Technical Analysis of ADME 2024-05-10
Overview:
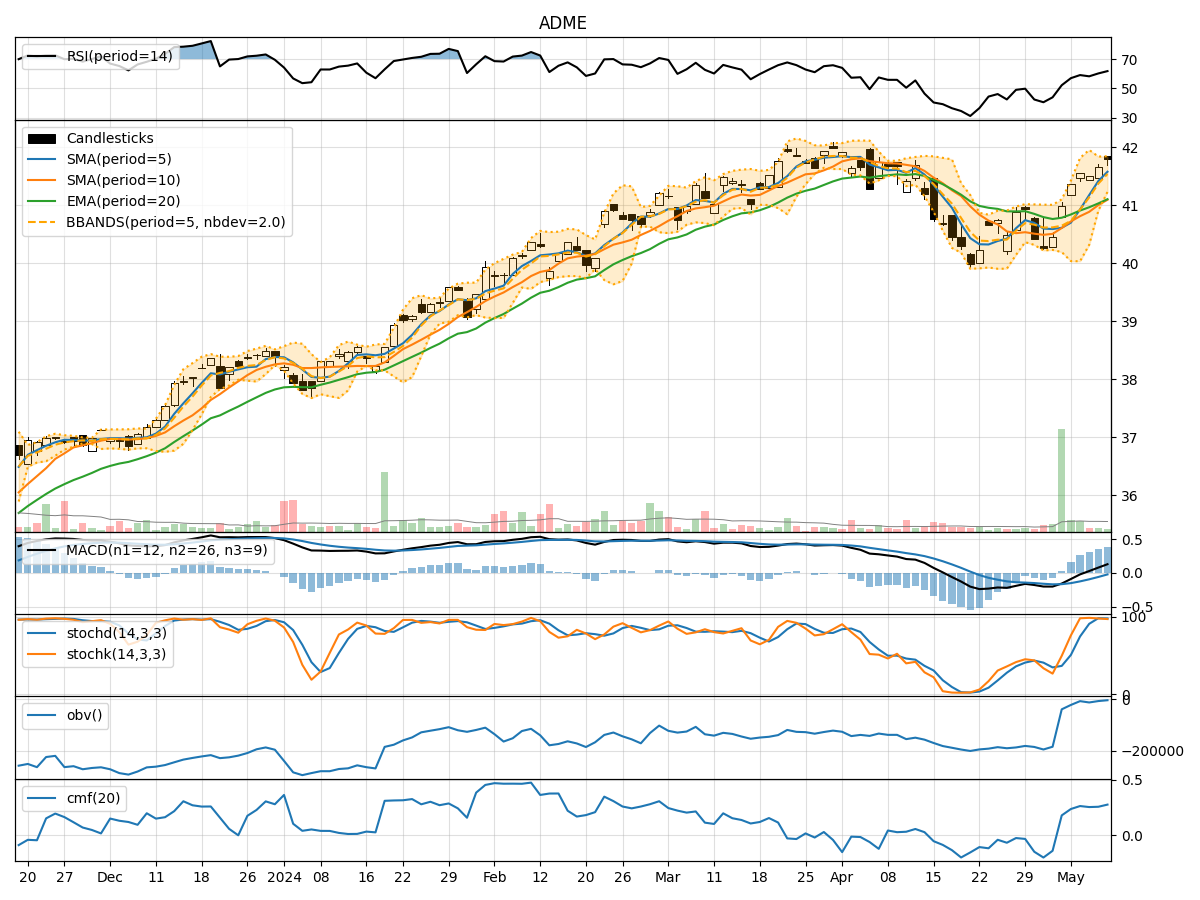
In the last 5 trading days, the stock has shown a consistent uptrend in terms of closing prices. The moving averages (MA) have been trending upwards, indicating a positive momentum. The Relative Strength Index (RSI) and Stochastic indicators suggest the stock is in overbought territory, while the Bollinger Bands show increasing volatility. The On-Balance Volume (OBV) and Chaikin Money Flow (CMF) indicators reflect positive accumulation.
Trend Analysis:
- Moving Averages (MA): The 5-day MA has been consistently above the 10-day Simple Moving Average (SMA), indicating a short-term bullish trend. The Exponential Moving Average (EMA) has also been trending upwards, supporting the bullish sentiment.
- MACD: The MACD line has been above the signal line for the past 5 days, with both lines in positive territory. The MACD Histogram has been increasing, indicating strengthening bullish momentum.
Momentum Analysis:
- RSI: The RSI has been above 70 for the last few days, suggesting the stock is overbought and may be due for a pullback.
- Stochastic Oscillator: Both %K and %D lines have been in the overbought zone, indicating a potential reversal in the short term.
- Williams %R: The Williams %R is also in the overbought region, signaling a possible downward correction.
Volatility Analysis:
- Bollinger Bands: The Bollinger Bands have been widening, indicating increasing volatility in the stock price. The current price is near the upper band, suggesting a potential reversal or consolidation.
Volume Analysis:
- On-Balance Volume (OBV): The OBV has been steadily increasing, indicating strong buying pressure and accumulation of the stock.
- Chaikin Money Flow (CMF): The CMF has been positive, reflecting a bullish money flow into the stock over the past 20 days.
Conclusion:
Based on the technical indicators and analysis: - Trend: The stock is in a strong upward trend, supported by moving averages and MACD. - Momentum: The overbought signals from RSI, Stochastic, and Williams %R suggest a potential short-term correction or consolidation. - Volatility: Increasing volatility as per Bollinger Bands may lead to a period of consolidation or a reversal in the stock price. - Volume: Positive OBV and CMF indicate strong buying interest and accumulation.
Overall View:
Given the overbought signals in momentum indicators and the potential for a pullback, combined with the increasing volatility and positive volume accumulation, the next few days may see a consolidation or a slight downward correction in the stock price. It is advisable to monitor the price action closely for signs of a reversal or continuation of the current trend.