Technical Analysis of AAPY 2024-05-10
Overview:
In analyzing the technical indicators for AAPY over the last 5 days, we will delve into the trend, momentum, volatility, and volume indicators to provide a comprehensive outlook on the possible stock price movement. By examining these key aspects, we aim to offer valuable insights and predictions for the upcoming days.
Trend Analysis:
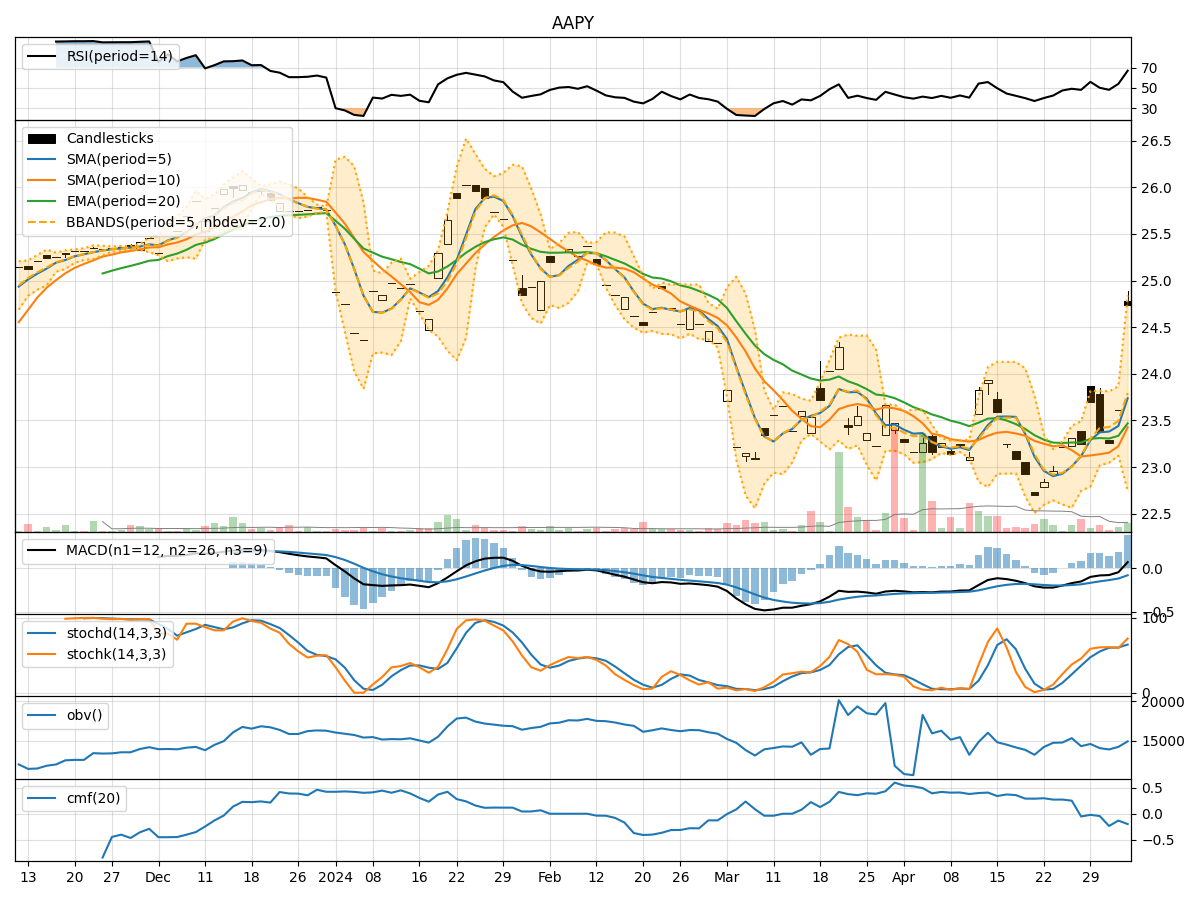
- Moving Averages (MA): The moving averages have been trending upwards, indicating a positive momentum in the stock price.
- MACD: The MACD line has been consistently above the signal line, suggesting a bullish trend.
- RSI: The RSI values have been in the overbought territory, indicating a strong bullish momentum.
Momentum Analysis:
- Stochastic Oscillator: Both %K and %D values have been in the overbought zone, signaling a potential reversal or consolidation.
- Williams %R: The Williams %R values have been in the oversold region, suggesting a possible reversal in the stock price.
Volatility Analysis:
- Bollinger Bands: The stock price has been trading within the upper and lower bands, indicating a period of volatility.
- BB% (Bollinger Band Percentage): The BB% values have fluctuated, reflecting the changing volatility in the stock.
Volume Analysis:
- On-Balance Volume (OBV): The OBV values have shown a mixed trend, indicating indecision among investors.
- Chaikin Money Flow (CMF): The CMF values have been negative, suggesting a bearish sentiment in the stock.
Key Observations:
- The stock has exhibited strong bullish momentum based on the moving averages, MACD, and RSI indicators.
- However, the overbought conditions in the Stochastic Oscillator and Williams %R signal a potential reversal or consolidation.
- Volatility has been present in the stock price movements, as indicated by the Bollinger Bands.
- The negative CMF values imply a bearish sentiment among investors.
Conclusion:
Based on the analysis of the technical indicators, the stock price of AAPY is likely to experience a short-term consolidation or pullback in the upcoming days. The overbought conditions in the momentum indicators and the negative CMF values suggest a possible reversal in the bullish trend. Traders should exercise caution and consider potential profit-taking opportunities in the current market environment.