Technical Analysis of AAAU 2024-05-10
Overview:
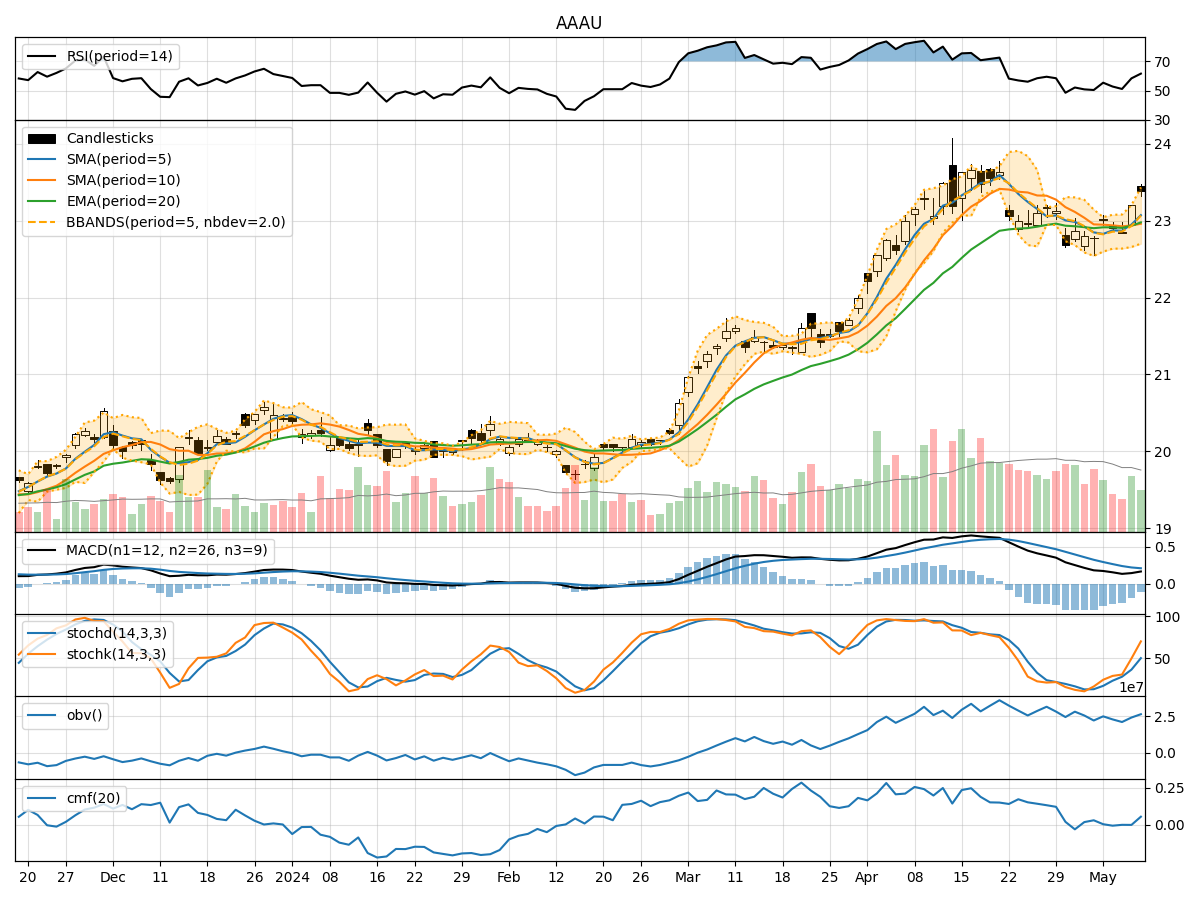
In analyzing the technical indicators for AAAU over the last 5 days, we will delve into the trend, momentum, volatility, and volume indicators to provide a comprehensive outlook on the possible stock price movement. By examining these key aspects, we aim to offer valuable insights and predictions for the upcoming trading days.
Trend Analysis:
- Moving Averages (MA): The 5-day MA has been showing an upward trend, indicating a positive momentum in the stock price.
- MACD and Signal Line: The MACD line has been consistently above the signal line, suggesting a bullish trend in the short term.
- Relative Strength Index (RSI): The RSI has been fluctuating around the neutral zone, indicating a balanced buying and selling pressure.
Momentum Analysis:
- Stochastic Oscillator: The Stochastic Oscillator has been in the overbought territory, signaling a potential reversal or consolidation phase.
- Williams %R (Willr): The Willr indicator has been hovering in the oversold region, suggesting a possible bullish reversal.
Volatility Analysis:
- Bollinger Bands (BB): The Bollinger Bands have been widening, indicating increased volatility in the stock price.
- Bollinger Band %B (bbp): The %B indicator has been fluctuating, reflecting the price's relationship to the bands.
Volume Analysis:
- On-Balance Volume (OBV): The OBV has shown mixed signals, with fluctuations in volume accumulation.
- Chaikin Money Flow (CMF): The CMF has been slightly negative, indicating some selling pressure in the market.
Key Observations:
- The trend indicators suggest a bullish sentiment in the short term.
- Momentum indicators point towards a potential reversal or consolidation phase.
- Volatility indicators indicate increased price fluctuations.
- Volume indicators show mixed signals with no clear direction.
Conclusion:
Based on the analysis of the technical indicators, the next few days' possible stock price movement for AAAU could be sideways with a slight bullish bias. Traders should monitor the Stochastic Oscillator for a potential reversal signal and keep an eye on the Bollinger Bands for any significant price breakouts. It is essential to exercise caution and wait for confirmation from multiple indicators before making trading decisions.